How Progressive Reform Created the Conditions for Special Interest Capture in an American City

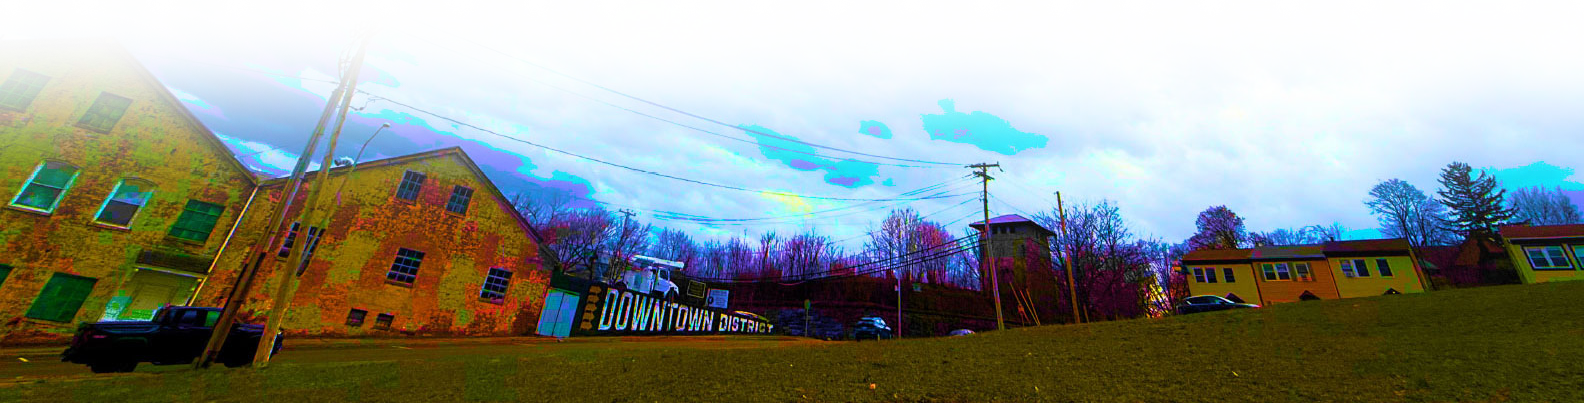
PART 5: NEWBURGH IS AMERICA
The five incidents documented in Parts 3 and 4 span sixty years and involve different people, different politics, and different circumstances. A housing crisis. A welfare crackdown. A demolition campaign. A partisan installation. A waterfront sabotage. Each was specific to Newburgh. Each involved individual decisions by individual actors.
But each was made possible by the same structural feature: an unelected city manager with operational control, insulated from the electorate, governing a city whose residents had no mechanism to hold him directly accountable.
The question this raises is obvious. Was Newburgh unusual? Were these outcomes the product of local failures — bad luck, bad managers, bad politics — that were simply anecdotal occurrences under a council-manager charter? Or does the form itself facilitate these outcomes?
I took a deeper look into the urban renewal period of the late 1950s through the early 1970s, the largest federally funded program of civilian displacement in twentieth-century American history, and widely considered the single biggest, most destructive disaster to hit Newburgh, NY.
I wanted to know whether the form of municipal government affected how aggressively cities pursued displacement.
I merged two datasets: the University of Richmond’s “Renewing Inequality” dataset records of urban renewal displacement in 598 American cities from 1950 to 1966, drawn from federal quarterly reports filed by local renewal agencies with the Housing and Home Finance Agency (1), and the ICMA Municipal Form of Government Survey (1981), which classifies the government structure of 4,672 municipalities.(2) I matched every city in the Richmond displacement data to its ICMA-verified government form. For cities not included in the ICMA survey — including Chicago, Philadelphia, Boston, Baltimore, and Detroit — I coded government form from historical charter records. These are cities whose government form is not subject to dispute.
The result: 430 cities classified by government form — 215 council-manager, 215 mayor-council — covering 95.7% of all displaced families in the federal record. Per-capita rate analysis was conducted for all cities where 1960 Census population data was available.
Urban historians study urban renewal. Political scientists study government form. No prior scholarship — to the best of my knowledge — has combined and connected them. What follows is what the data showed me.

I. The Core Finding
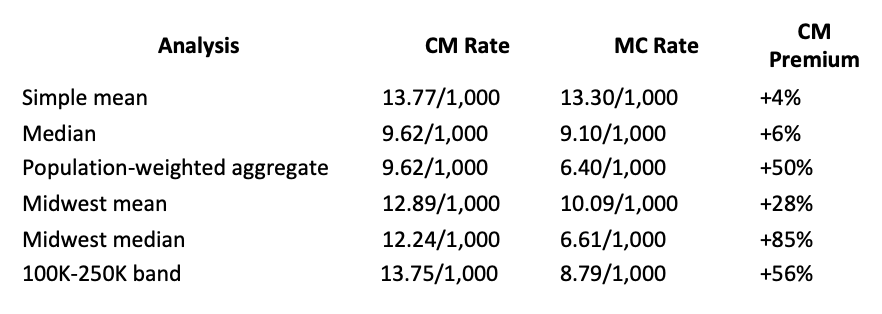
Council-manager cities displaced families at higher per-capita rates than mayor-council cities across every major analytical approach.
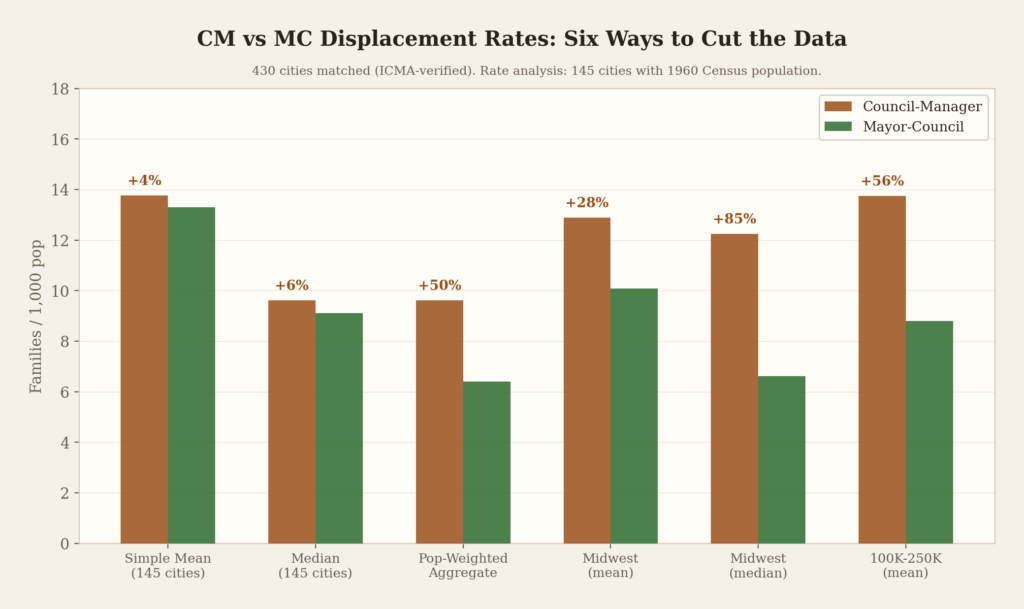
The simple mean — the first pair of bars — shows only a 4% gap. This is the smallest gap in the dataset, and it is worth explaining why.
A simple mean treats every city as equal. Rankin, Pennsylvania (population 7,312, displacement rate 72.35 per 1,000) counts the same as Chicago (population 3,550,404, displacement rate 6.61 per 1,000). Several tiny mayor-council boroughs near Pittsburgh — Rankin, Braddock, Carbondale — have extreme per-capita rates because any single demolition project in a town of seven or eight thousand produces an astronomical number. These outliers pull the MC average up and compress the gap.
Every other measure corrects for this distortion — and every other measure finds a substantial CM premium:
The median asks what the typical city looks like, regardless of outliers. The typical CM city displaced 9.62 families per 1,000 residents. The typical MC city displaced 9.10. A 6% premium.
The population-weighted rate asks how many people were affected. It weights each city by population, so that Cincinnati’s 502,550 residents count more than Mount Clemens’s 19,551. CM cities displaced 9.62 families per 1,000. MC cities displaced 6.40. A 50% premium.(3)
The Midwest mean isolates the region with the cleanest comparison — no Jim Crow overlay, strong representation of both forms, similar demographics. CM cities displaced at a 28% higher rate. The Midwest median is even more striking: the typical CM city displaced at 85% higher rates than the typical MC city.
The 100K-250K band — cities large enough to have competing class interests, small enough that a professional manager can operate without meaningful public scrutiny — shows a 56% premium.
A critic who cites the simple mean while ignoring the five other measures that all point the same direction is not doing analysis. They are shopping for the number most distorted by tiny-town outliers.
II. The Size Effect
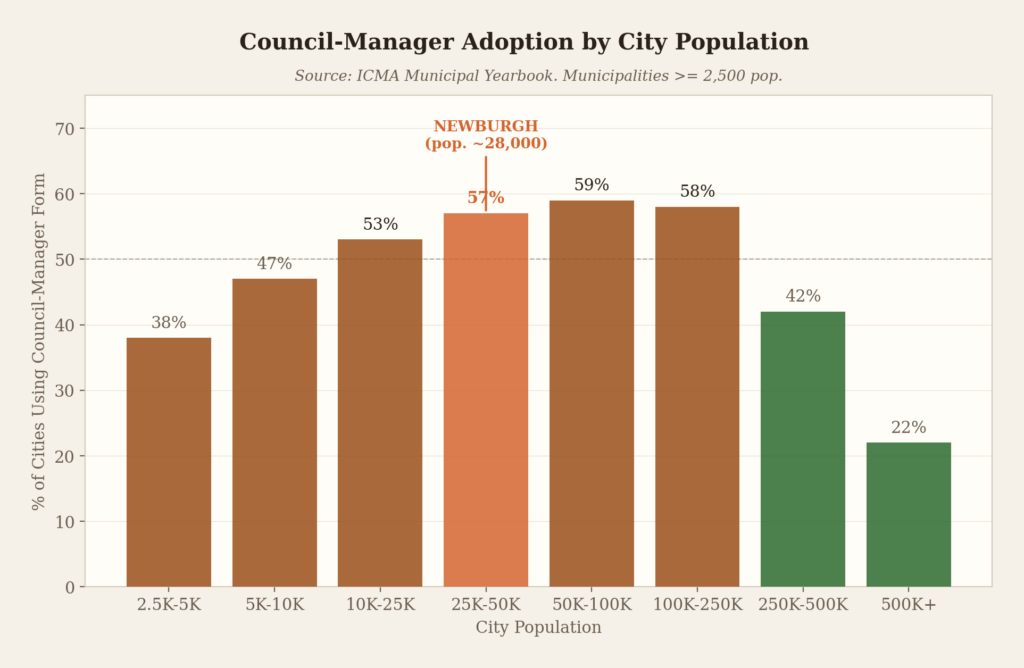
Council-manager government is not evenly distributed across city sizes. It peaks in midsize cities — 25,000 to 100,000 population — where 57-59% of municipalities use the form.(4) Above 500,000, fewer than one in five retain it. The biggest American cities either never adopted the council-manager form or switched back to elected mayors.
This matters because the CM displacement premium is strongest in exactly this population range.
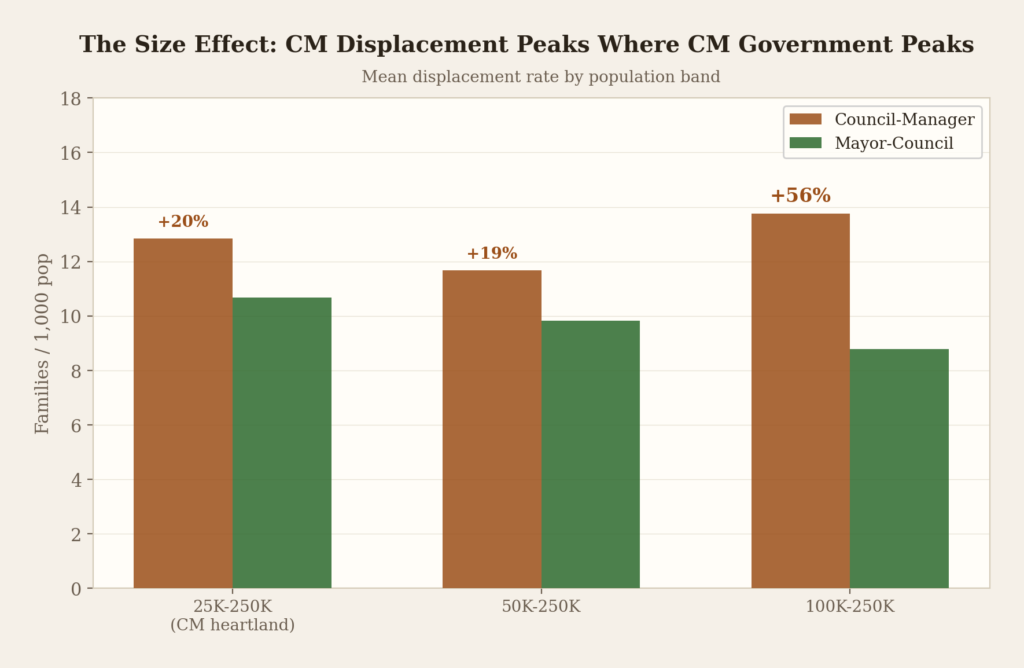
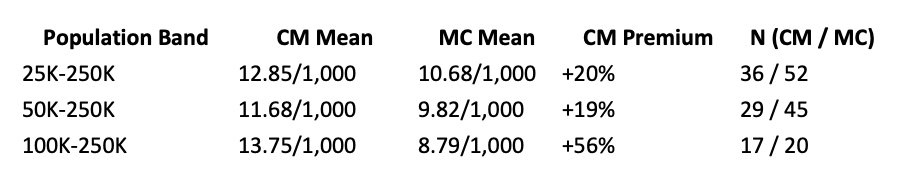
In cities of 100,000 to 250,000 — the sweet spot — council-manager cities displaced families at 56% higher rates than mayor-council cities. Seventeen CM cities against twenty MC cities. The gap is enormous.(5)
Newburgh, with a 1960 population of 30,978, sits squarely in the band where council-manager government is most prevalent.
III. Racial Targeting
Council-manager cities did not just demolish more. They targeted nonwhite families at dramatically higher rates.
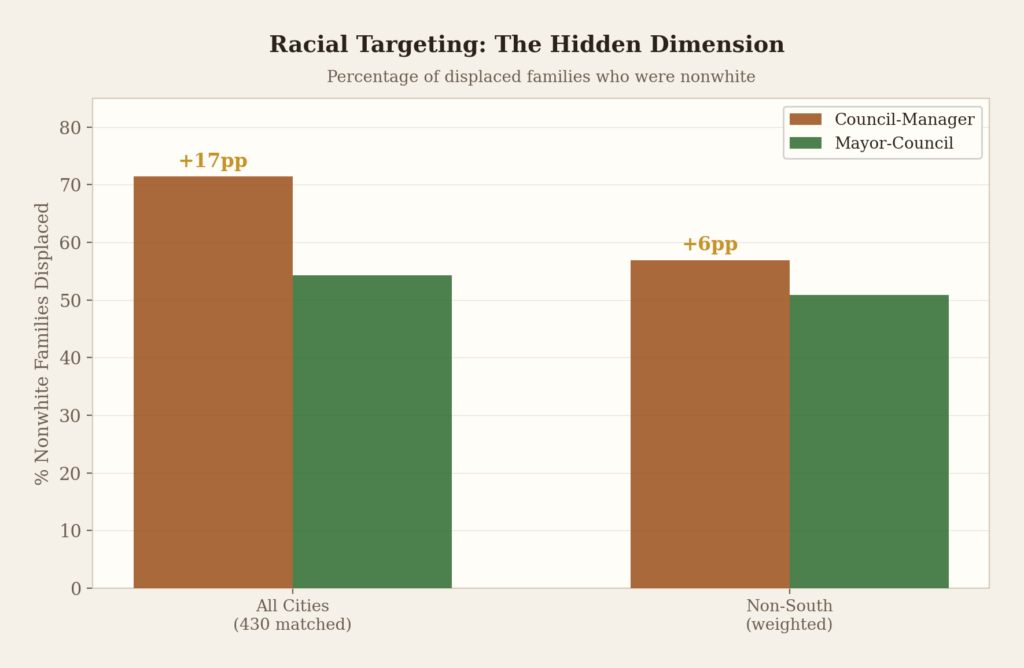
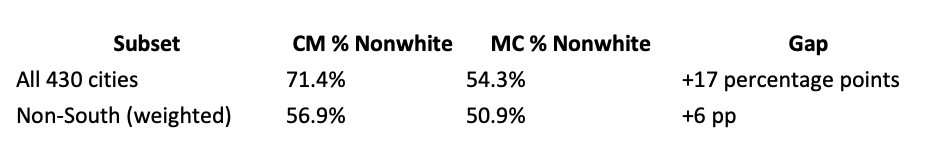
Across all 430 matched cities, 71.4% of families displaced in council-manager cities were nonwhite, versus 54.3% in mayor-council cities. A 17-percentage-point gap.(6)
The non-South comparison narrows the gap to 6 points, suggesting that much of the racial targeting in CM cities is concentrated in the South, where the manager structure provided an additional institutional layer for executing racially motivated demolition that was already happening through every available mechanism.
But the displacement rate gap persists outside the South. Non-Southern CM cities displaced at 8.27 families per 1,000. Non-Southern MC cities displaced at 6.14. A 35% premium — even after removing the South entirely.(7)
The professional manager did not invent racial targeting. But the structure provided cover for it. No elected mayor had to look Black voters in the eye and explain why their neighborhood was being bulldozed. The professional manager did it as policy.
In Newburgh: 89% of families displaced through 1966 — 288 of 323 in the federal records — were nonwhite.
IV. The Midwest Proof
The South confounds the national comparison. Jim Crow operated through every institution — CM and MC alike — making it difficult to isolate the effect of government form. The Midwest provides the cleanest test: strong representation of both forms, similar demographics, no Jim Crow overlay.
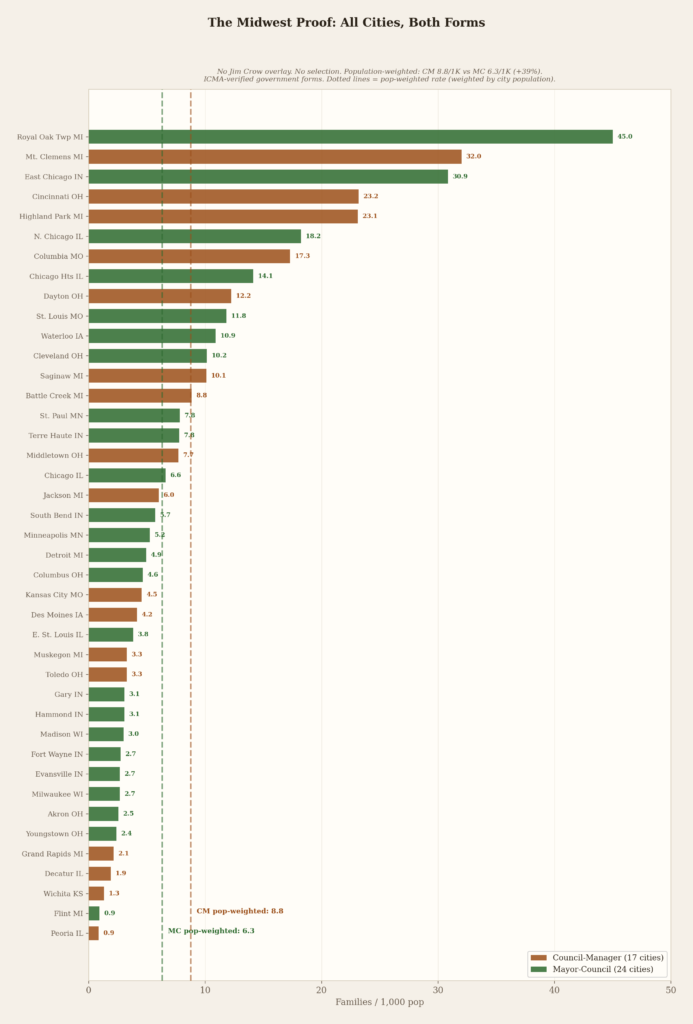
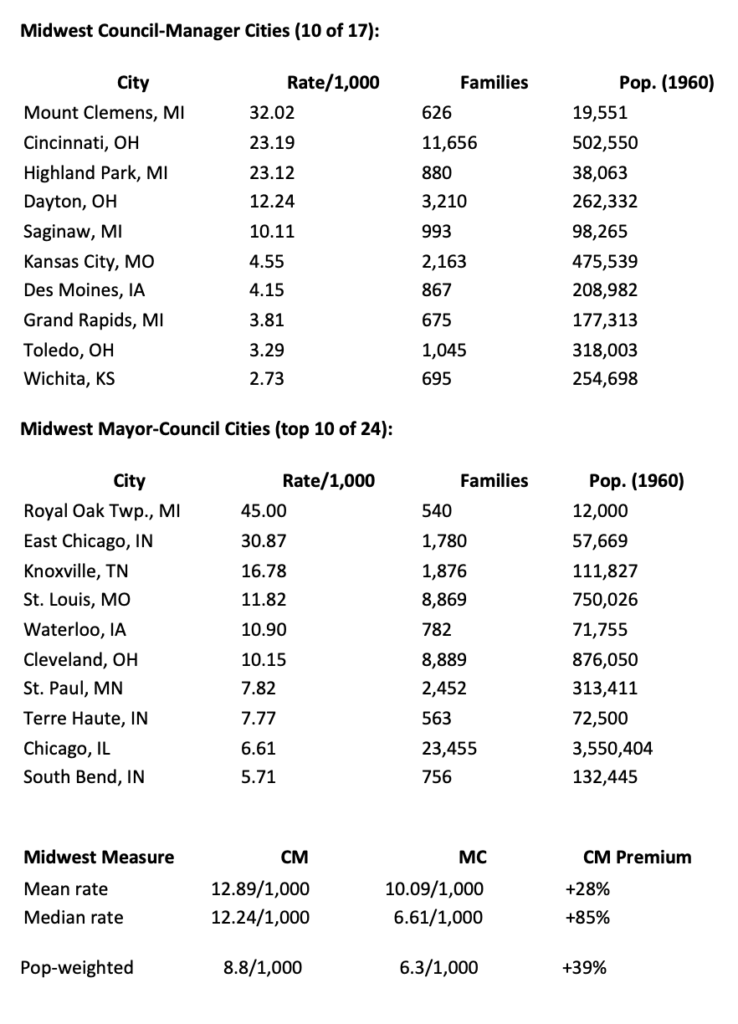
Seventeen CM cities. Twenty-four MC cities.(8)
Cincinnati — a council-manager city — displaced 11,656 families at a rate of 23.19 per 1,000. Ninety-six percent of them were nonwhite. Chicago — a mayor-council city with eight times Cincinnati’s population — displaced 23,455 families at a rate of 6.61 per 1,000. The absolute number was larger. The rate was less than a third of Cincinnati’s.
The MC outliers — Royal Oak Township and East Chicago — are small communities where single projects produce extreme per-capita numbers, just as in the national data. Exclude them and the gap widens further.
V. The Most Extreme Case
The most extreme city in the dataset by the federal numbers is Lubbock, Texas — a council-manager city.
Lubbock’s 1960 population was 128,691. The federal quarterly reports show 12,181 families displaced — a rate of 94.65 per 1,000. This number requires scrutiny. Local sources cite approximately 1,300 families displaced over the course of the urban renewal program.(9) The discrepancy may reflect double-counting across multiple overlapping projects in the federal reporting, cumulative rather than net displacement estimates, or other data artifacts in the quarterly reports.
What is not in dispute: only 3% of Lubbock’s population was nonwhite. One hundred percent of the displaced families were families of color. Regardless of whether the total is 1,300 or 12,181, every single family displaced by urban renewal in Lubbock was nonwhite, in a city that was 97% white.
The city’s segregation ordinances date to 1923, when the mayor signed a law forbidding Black residents from living outside the southeast side.(10) The city’s 1943 land use plan surrounded the Black neighborhood — Chatman Hill — with industrial zoning to enforce Jim Crow by other means.(11)
Urban renewal was the next step. The professional manager executed it. The at-large council had no representative from the affected neighborhood. It never became a national scandal. Nobody wrote about it. The structure made it invisible.
Today, unemployment in North Lubbock approaches 40%. Population growth on the east side has been zero. In 2019, Texas Housers and the Lubbock NAACP filed a federal Fair Housing Act complaint alleging that the city’s zoning still concentrates industrial pollution in Black and Hispanic neighborhoods.(12) The city council declined to change its land use plan.
Lubbock is not a comparison to Newburgh. It is the extreme case that proves the mechanism. At 1,300 families — the local figure — Lubbock’s rate would be approximately 10.10 per 1,000, comparable to many other CM cities in the dataset. What makes Lubbock exceptional is not the rate but the racial completeness: the entire nonwhite population of the city was displaced. The structure did not merely enable racial targeting. It executed the most racially complete displacement program in the federal record — and the structure’s insulation from democratic accountability ensured that nobody paid a political price for it.
In 1921, an angry, violent white mob took to the streets of the Greenwood District — a successful African American community known as “Black Wall Street”, featuring numerous Black-owned businesses, hotels, and luxury shops — in Tulsa, Oklahoma, massacred as many as 300 people, destroyed 35 square blocks, and left more than 10,000 people homeless.
Lubbock accomplished similar destruction through a professionalized bureaucratic process. The Greenwood District was rebuilt by its residents within a decade. Lubbock has not recovered in sixty years.
VI. Newburgh in National Context
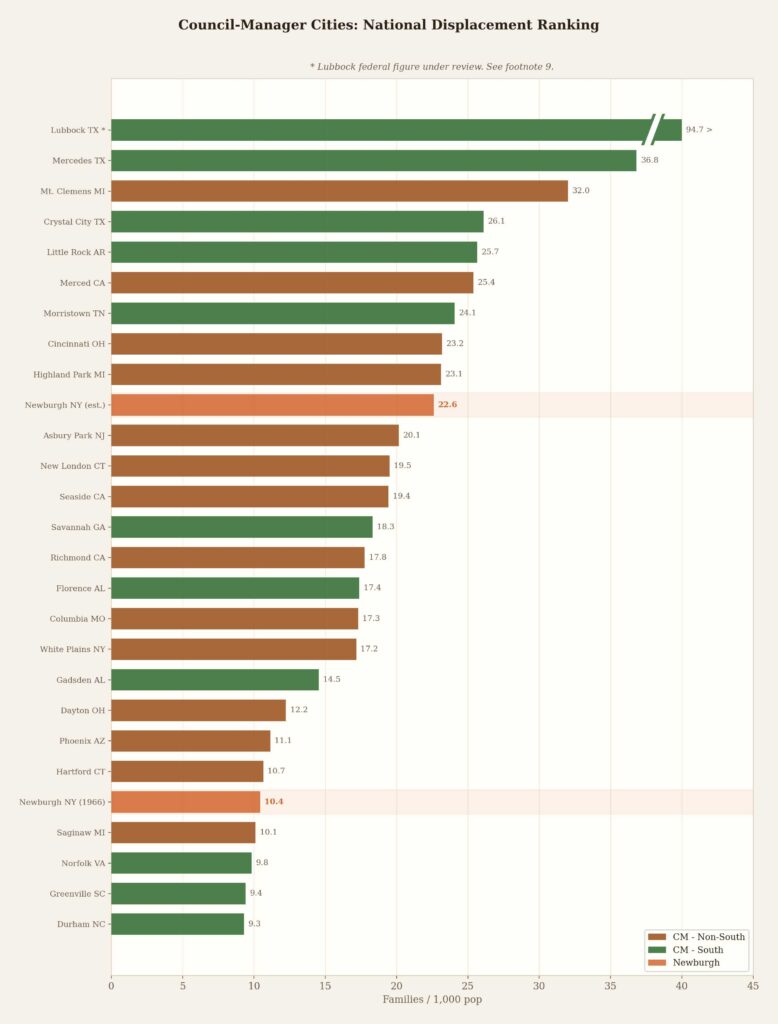
At the federal data rate of 10.43 per 1,000, Newburgh ranks in the middle of the pack among council-manager cities.
But the federal data covers only through 1966. Demolition in Newburgh continued through 1973. The actual toll: approximately 1,300 buildings demolished, more than 700 families displaced, more than 120 acres cleared.(13) Using the estimated 700 families against the 1960 population of 30,978 yields a rate of approximately 22.6 per 1,000.
This is important — and it requires a caveat. The same undercount almost certainly applies to other cities. Cincinnati’s demolitions did not stop in 1966. Neither did Dayton’s or Little Rock’s. The federal dataset truncates every city’s record at the same point. Comparing Newburgh’s corrected number against other cities’ uncorrected numbers would inflate Newburgh’s relative position unfairly.
What the two numbers demonstrate is not that Newburgh was the worst. They demonstrate that the federal record — which is what every scholar has relied on — systematically understates the actual displacement. In Newburgh, the undercount is more than 50%. In other cities, the gap is unknown but likely substantial.
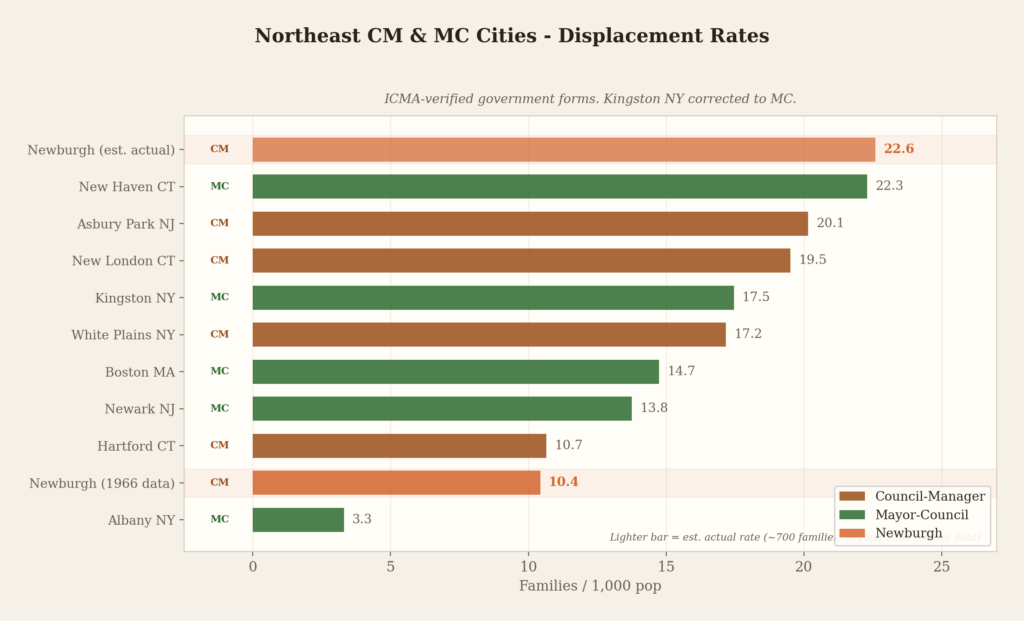
Among Northeast cities over 10,000 population, Newburgh’s estimated actual rate of 22.6 per 1,000 would place it first among council-manager cities — above Asbury Park, New Jersey (20.15), New London, Connecticut (19.51), and White Plains, New York (17.17). It would also exceed New Haven, Connecticut (22.29), the mayor-council city most associated with urban renewal in the American imagination, the city where the phrase was practically defined under Edward Logue.(14)
The city everyone knows about — New Haven — sits just below the city nobody talks about.
VII. What the Data Means
No prior scholarship — to the best of my knowledge — has overlaid municipal government form onto urban renewal displacement data. This analysis is the first to do so.
I am not an urban historian. I am not a political scientist. I am an artist whose body of work examines the intersectionality of political, economic, and institutional structures. This draft longitudinal study, and the series of essays that it is situated within, is my attempt to make some sense of the city I moved to nine years ago, that I now call home.
I am working with limited analytical tools.
These limitations must be stated plainly.
Government forms were classified using the ICMA Municipal Form of Government Survey (1981) as the primary source, covering 4,672 municipalities. Of the 430 cities matched, 396 were classified directly from the ICMA data; 34 were hand-coded from historical charter records for cities that did not respond to the 1981 survey.(15) Per-capita rate analysis covers the 145 cities for which 1960 Census population data was available. The federal displacement figure for Lubbock, Texas requires independent verification against primary sources.
There are no multivariate controls for population, percentage nonwhite, region, highway construction, or state enabling legislation.
What the data shows, without those controls, is a consistent pattern across every analytical approach: council-manager cities displaced families at higher per-capita rates, in every population band, in every region except the South (where Jim Crow drove demolition through all institutions), with higher racial targeting in the CM heartland of midsize cities.
It is my view that once a regression is applied, the thesis will remain standing. That thesis is the following: the “professionalized” insulation of the city manager form — originally a Progressive Era reform — functioned as a high-efficiency delivery system for federal urban renewal goals by bypassing democratic friction.
This thesis parallels my work in 1994, where I created an artwork designed to argue that the distinction between political speech and commercial speech in Public Forum Doctrine was a fiction designed to privilege commercial speech, and that led to the Supreme Court’s 8-1 decision in Lebron v. Amtrak (Scalia opinion), which established that the state cannot bypass constitutional accountability by delegating its functions to “professionalized” corporate entities.
The structural explanation for this pattern is not speculative. It is the design. The council-manager form was created to insulate executive decisions from democratic pressure. It accomplished this through three mechanisms: an unelected executive with operational control, at-large elections that eliminated ward accountability, and — significantly, and I will go into this at greater depth in a later essay — an ideology of professionalism that reframed political decisions as administrative ones. During the period of American history when government-sponsored displacement reached its peak, these mechanisms operated exactly as designed — enabling the demolition of neighborhoods with little electoral consequence to the officials who ordered it.
The data does not prove that council-manager government caused urban renewal. Urban renewal was a federal program adopted by cities of every governmental form. The data shows that the council-manager form provided the institutional mechanism that most facilitated its execution — efficiently, disproportionately, and with little democratic accountability.
Progressive Era business reformers did not imagine that facilitating urban renewal would be a consequence of their design. Nevertheless, that outcome is not wholly inconsistent with their intent.
It cost 25,339 families their homes.
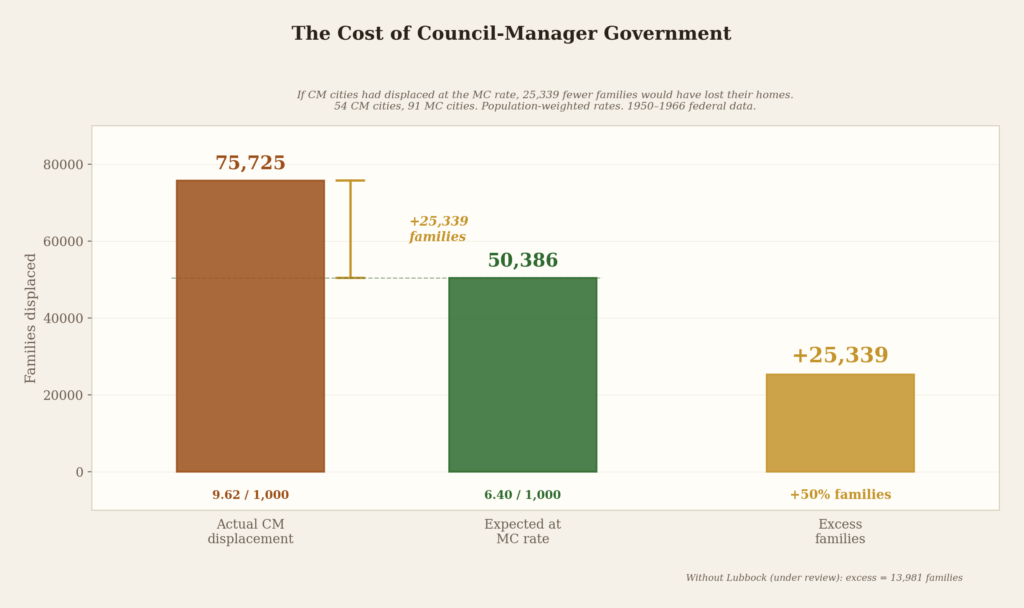
25,339 families. That is two and a half times all the households in the City of Newburgh, per the 2019–2023 American Community Survey.
Newburgh didn’t have a Jane Jacobs to stop the disaster. It had a Barry Benepe who arrived too late and a charter that gave the displaced community no structural channel to effectively resist.
The city manager system in Newburgh at the time had only at large councilmembers. This diluted the strength of the minority populations, who likely were not represented. If Newburgh had a mayor-council system with ward councilmembers, the waterfront would likely have had at least two members specifically representing the affected community. An at-large member could sympathize. A ward member would have had to fight.
Two people with a strong incentive and the structural power to organize and marshal resistance. Two voices on the council when the demolition vote came, with a platform to win over more. Then we might still have an intact neighborhood with a Black community holding generational wealth instead of a community that was scattered to the wind like leaves on a late autumn day.
We will never know.
Newburgh was not an aberration. Newburgh was the pattern.
—————————————————————————
© March 18, 2026 Michael Lebron
NEXT: PART 6 — THE IDEOLOGY OF PROFESSIONALISM: THE MASK OF NEUTRALITY
Notes
(1) University of Richmond Digital Scholarship Lab, “Renewing Inequality: Family Displacements through Urban Renewal, 1950-1966.” Available at https://dsl.richmond.edu/panorama/renewal/. Data licensed CC-BY-NC.
(2) ICMA Municipal Form of Government Survey (1981). 4,672 municipalities. Dataset accessed via Washington University Open Scholarship Repository (DOI: 10.7936/a9e1-2y17).
(3) Population-weighted rates: CM 9.62/1,000, MC 6.40/1,000. The MC total includes New York, Chicago, Detroit, and Philadelphia, whose enormous populations reduce the per-capita rate.
(4) ICMA, “Council-Manager Form of Government” brochure (2019). More than 120 million Americans live under the council-manager form.
(5) 100K-250K: 17 CM cities, 20 MC cities. CM mean 13.75/1,000. MC mean 8.79/1,000. Difference: +56%.
(6) Racial composition: 430 matched cities. CM 71.4% nonwhite, MC 54.3% nonwhite. Gap: +17pp.
(7) Non-South, population-weighted: CM 8.27/1,000, MC 6.14/1,000. +35%.
(8) 17 CM cities, 24 MC cities. Population-weighted: CM 8.8/1K, MC 6.3/1K, +39%. ICMA-verified.
(9) Lubbock: Federal figure 12,181 families. Local sources: ~1,300 (Fast Company, July 2018), 400+ homes (Texas Tech Hub, 2019). 100% nonwhite in a 97% white city.
(10) Texas Housers, September 5, 2019.
(11) Ibid.
(12) Texas Housers and Lubbock NAACP, HUD complaint, December 2019. Texas Observer, December 19, 2019.
(13) Newburgh totals from city planning documents and the Hillside BOA Nomination Study (May 2025).
(14) New Haven: 3,389 families, 152,048 population, 22.29/1,000. Mayor-council. See Rae, City: Urbanism and Its End (Yale, 2003).
(15) Of 598 Richmond cities, 415 matched ICMA directly, 15 via name variations, 34 hand-coded. 146 unmatched cities account for 4.3% of total displaced families. 22 commission cities excluded. Final: 215 CM, 215 MC.
Data: University of Richmond “Renewing Inequality” (CC-BY-NC), 598 cities. ICMA Municipal Form of Government Survey (1981), 4,672 municipalities. 430 cities matched: 215 CM, 215 MC. Population: 1960 U.S. Census.